基于 Prometheus 的 API 查询 Linux 系统指标
一、写在前面
最近项目上需要统计显示 Linux 系统指标,如 CPU、内存、磁盘使用情况等指标。虽然 Grafana 可以展示这些指标,但是将其内嵌至系统中展示可能并不友好,所以需要定制开发。
二、环境安装
目标服务器的 node_exporter 是直接装在系统上的。Prometheus 是通过 docker-compose 安装的。
version: '2'

networks:
  monitor:
    driver: bridge

services:
  prometheus:
    image: prom/prometheus
    container_name: prometheus
    hostname: prometheus
    restart: always
    volumes:
      - ./config/prometheus.yml:/etc/prometheus/prometheus.yml
    ports:
      - '9090:9090'
prometheus.yml 配置文件如下:
# my global config
global:
scrape_interval: 15s # Set the scrape interval to every 15 seconds. Default is every 1 minute.
evaluation_interval: 15s # Evaluate rules every 15 seconds. The default is every 1 minute.
# scrape_timeout is set to the global default (10s).
# Alertmanager configuration
alerting:
alertmanagers:
- static_configs:
- targets:
# - alertmanager:9093
# Load rules once and periodically evaluate them according to the global 'evaluation_interval'.
rule_files:
# - "first_rules.yml"
# - "second_rules.yml"
# A scrape configuration containing exactly one endpoint to scrape:
# Here it's Prometheus itself.
scrape_configs:
# The job name is added as a label `job=<job_name>` to any timeseries scraped from this config.
- job_name: "prometheus"
# metrics_path defaults to '/metrics'
# scheme defaults to 'http'.
static_configs:
- targets: ["10.64.4.78:9090"]
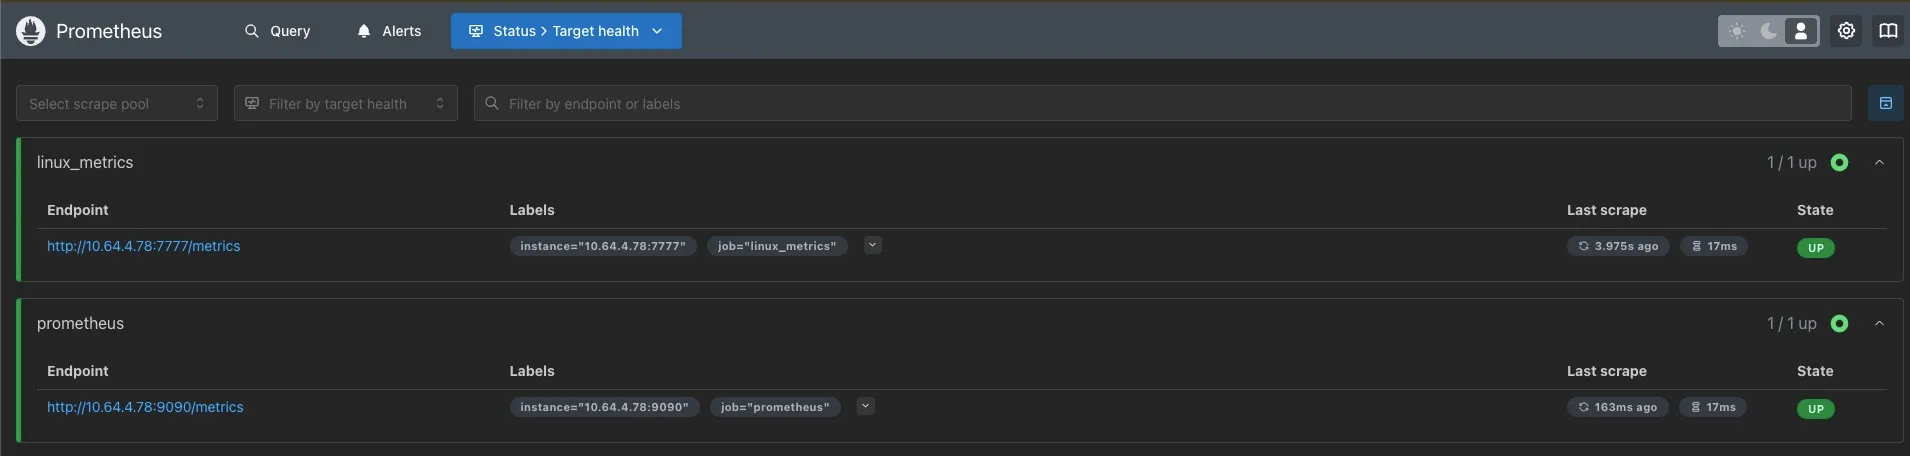
- job_name: "linux_metrics"
static_configs:
- targets: ["10.64.4.78:7777"]job_name 为 linux_metrics 的是我要监听的服务器。
三、指标查询
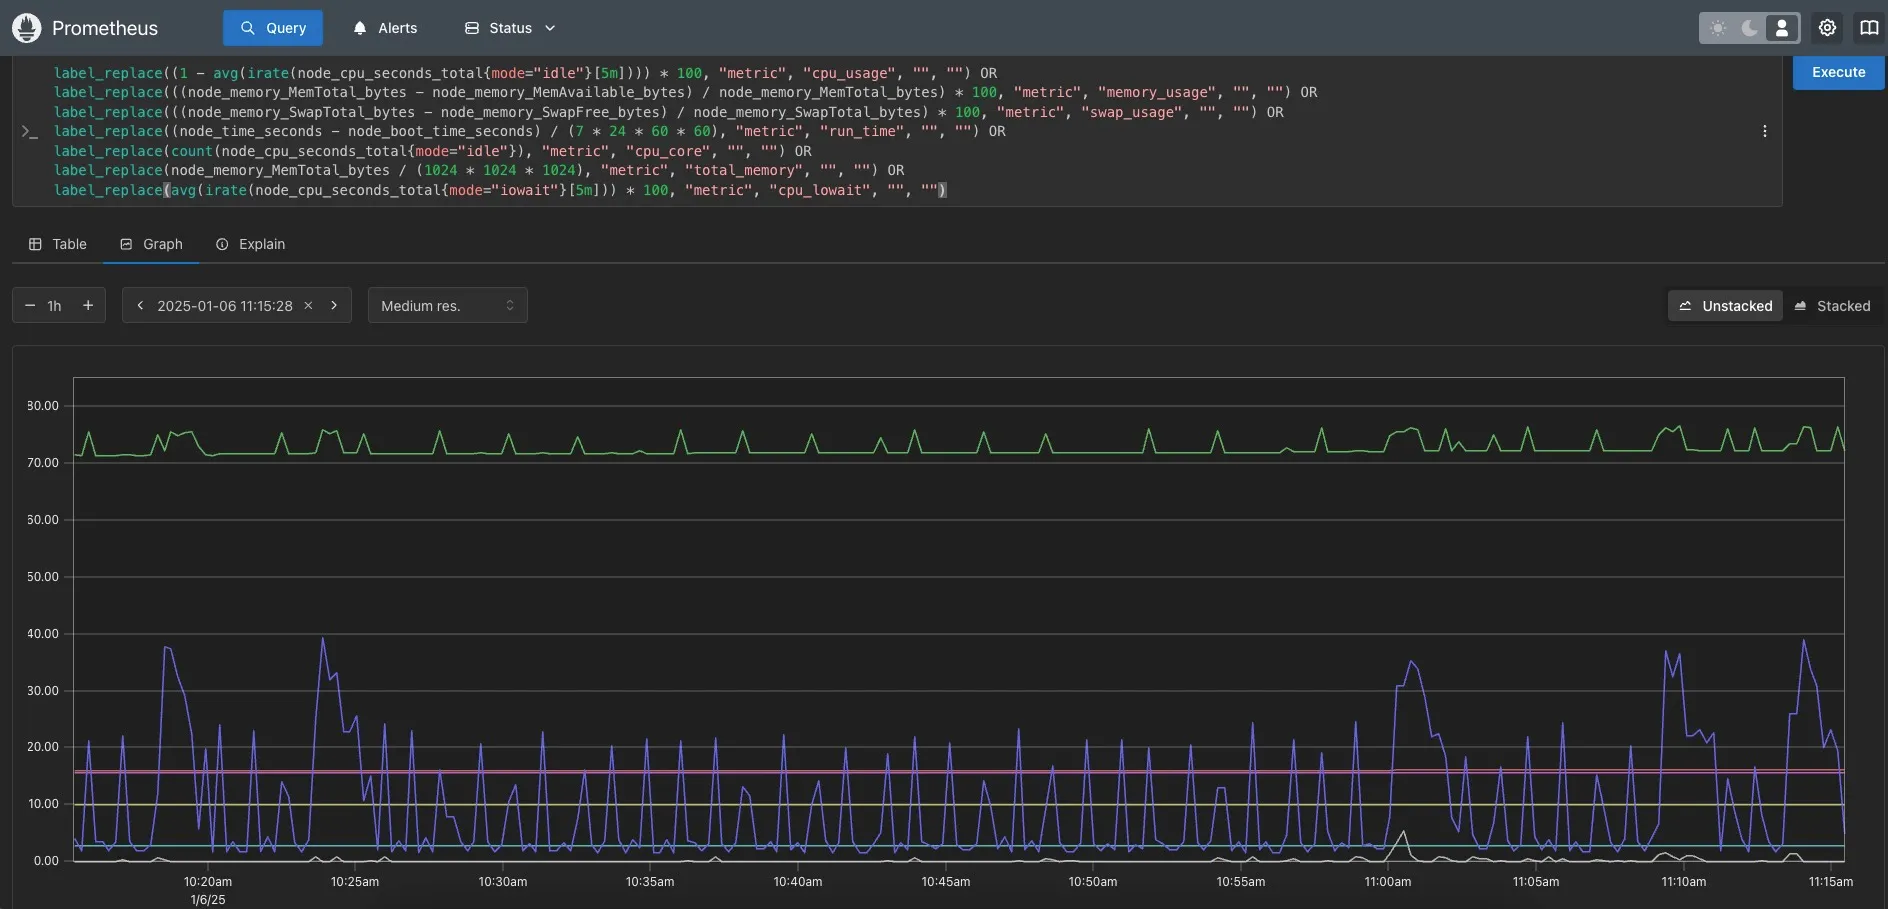
如图所示,可将 PromSQL 表达式写在查询栏内(多个指标用 OR 连接),下方图标会显示对应指标。
API 的使用与此类似,参考:https://prometheus.io/docs/prometheus/latest/querying/api/
我主要用的是 /api/v1/query 和 /api/v1/query_range
/api/v1/query
主要用来查询指标的当前状态。参数只有 query,参数值只要把 PromSQL 放进去即可。
如下所示:
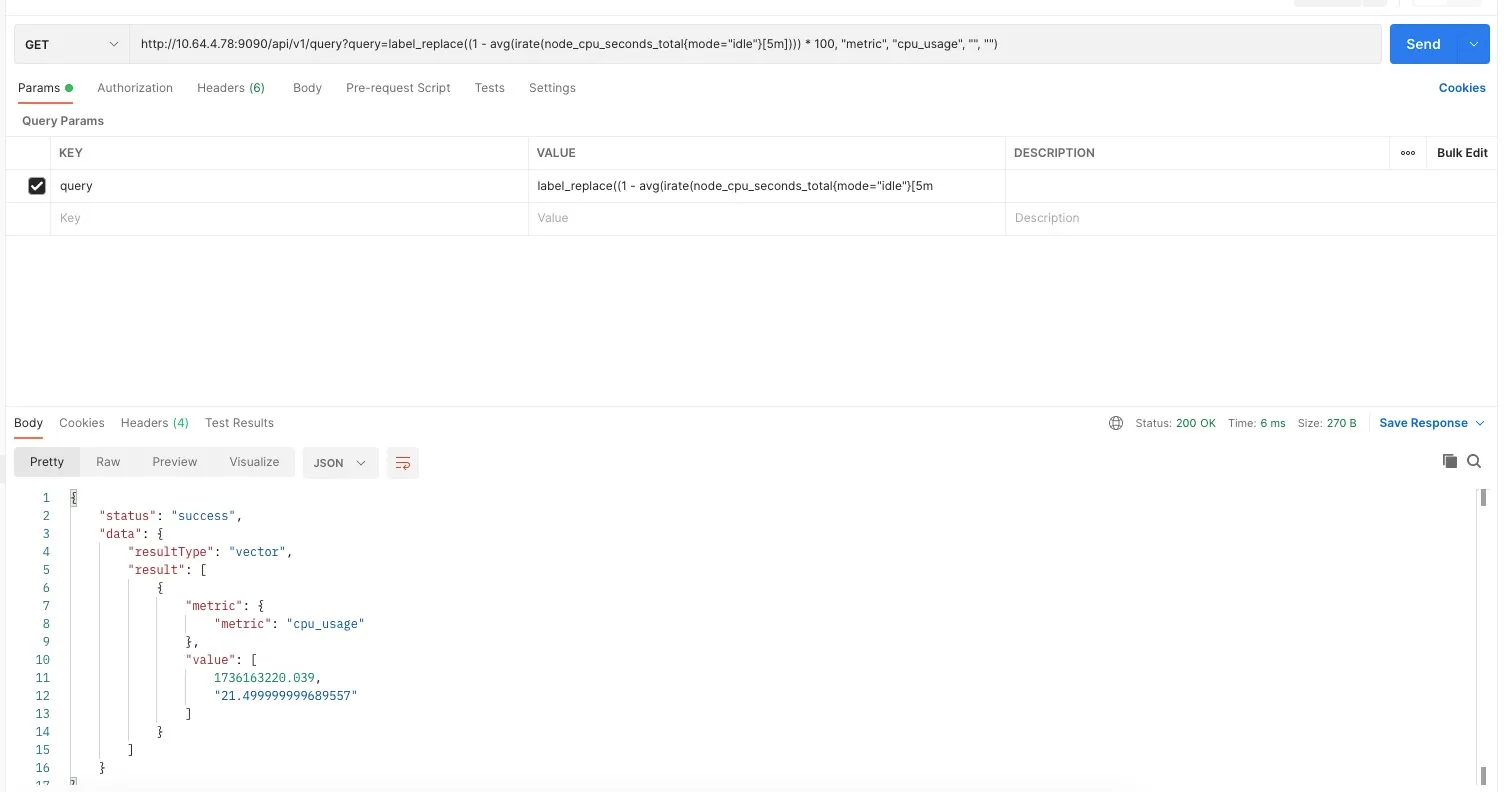
获取 CPU 使用率(多个指标可用 OR 连接),请求 URL:http://10.64.4.78:9090/api/v1/query?query=label_replace((1 - avg(irate(node_cpu_seconds_total{mode="idle"}[5m]))) * 100, "metric", "cpu_usage", "", "")
响应结构如下:
{
    "status": "success",
    "data": {
        "resultType": "vector",
        "result": [
            {
                "metric": {
                    "metric": "cpu_usage"
                },
                "value": [
                    1736163220.039,
                    "21.499999999689557"
                ]
            }
        ]
    }
}
/api/v1/query_range
主要用来查询指标在某一时间段内的状态。除了参数 query 外,还有三个参数:
- start:开始时间
- end:结束时间
- step:步长
上述三个参数的单位都是秒,返回结果里的时间戳也是秒。
如下所示,查询一个小时内系统 1 分钟和 5 分钟的负载情况,步长为 300 秒。
请求 URL:http://10.64.4.78:9090/api/v1/query_range?start=1735264800&end=1735268399&step=300&query=label_replace(node_load1{job='linux_metrics'}, "metric", "one_min_load", "", "") OR label_replace(node_load5{job='linux_metrics'}, "metric", "five_min_load", "", "")
响应如下:
{
"status": "success",
"data": {
"resultType": "matrix",
"result": [
{
"metric": {
"__name__": "node_load1",
"instance": "10.64.4.78:7777",
"job": "linux_metrics",
"metric": "one_min_load"
},
"values": [
[
1735264800,
"0.74"
],
[
1735265100,
"0.28"
],
[
1735265400,
"1.92"
],
[
1735265700,
"0.7"
],
[
1735266000,
"0.55"
],
[
1735266300,
"0.39"
],
[
1735266600,
"0.97"
],
[
1735266900,
"1.18"
],
[
1735267200,
"1.19"
],
[
1735267500,
"0.35"
],
[
1735267800,
"0.65"
],
[
1735268100,
"0.98"
]
]
},
{
"metric": {
"__name__": "node_load5",
"instance": "10.64.4.78:7777",
"job": "linux_metrics",
"metric": "five_min_load"
},
"values": [
[
1735264800,
"0.68"
],
[
1735265100,
"0.52"
],
[
1735265400,
"1.03"
],
[
1735265700,
"0.83"
],
[
1735266000,
"0.71"
],
[
1735266300,
"0.55"
],
[
1735266600,
"0.75"
],
[
1735266900,
"1.21"
],
[
1735267200,
"1.03"
],
[
1735267500,
"0.62"
],
[
1735267800,
"0.73"
],
[
1735268100,
"0.84"
]
]
}
]
}
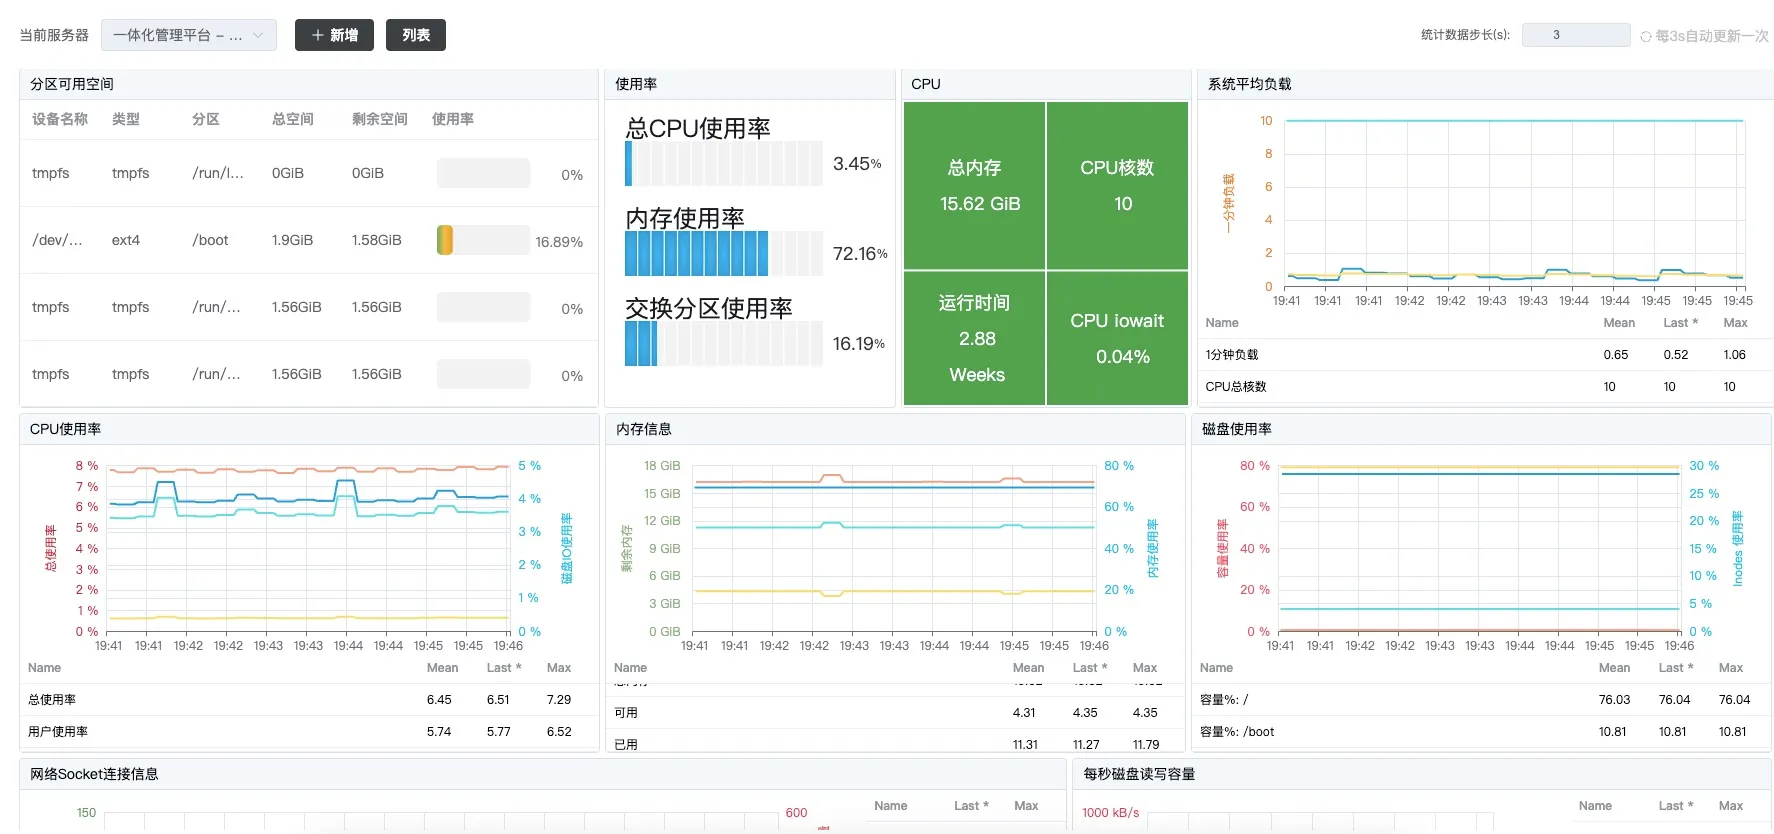
}四、效果呈现
有了这些数据,就可以在前端用 Echarts 来展示数据了,如下所示:
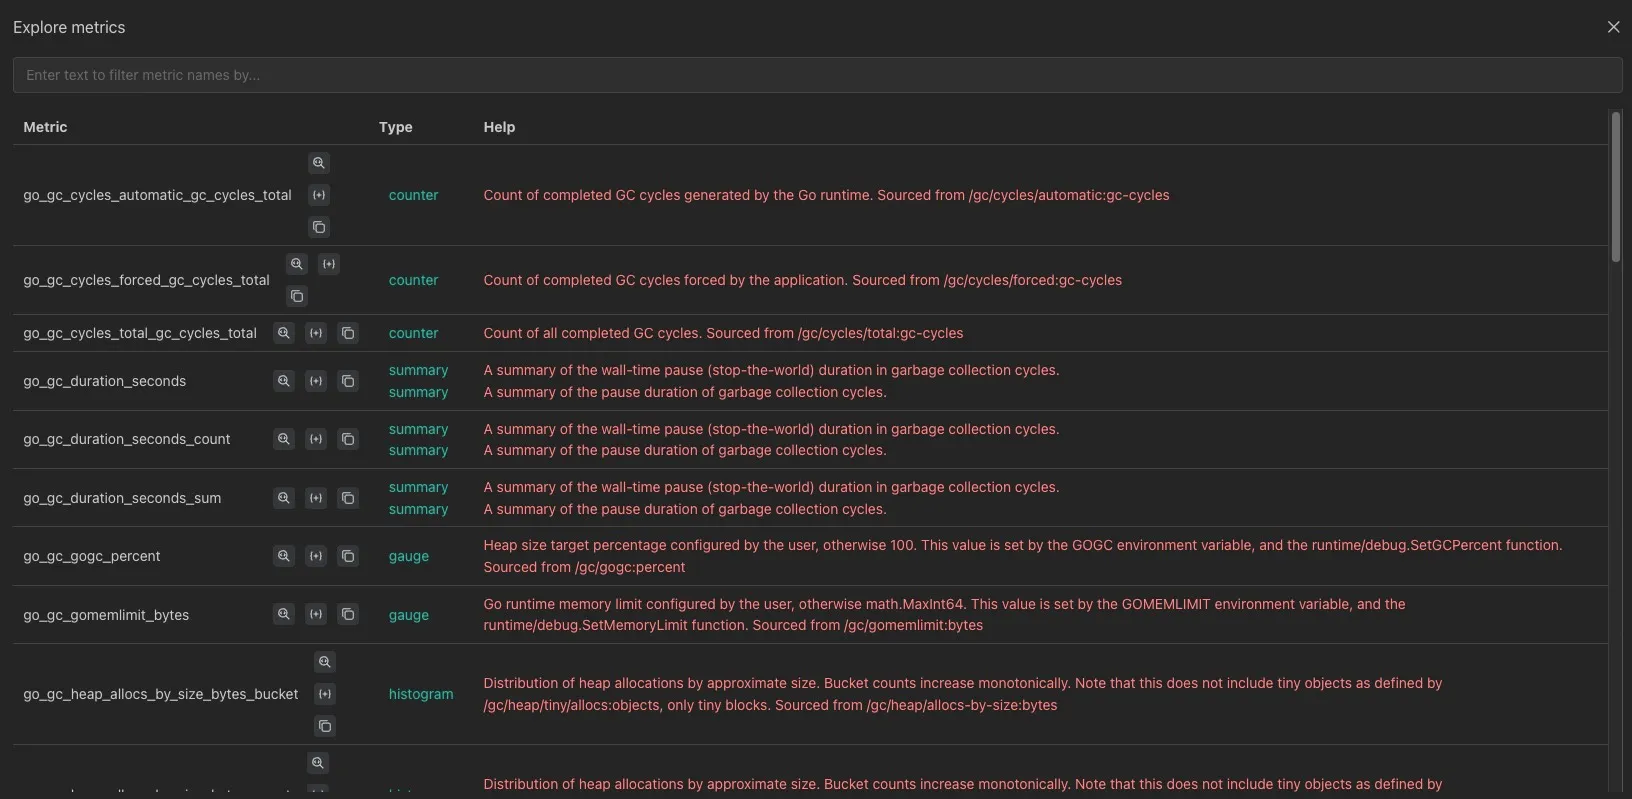
五、指标查询
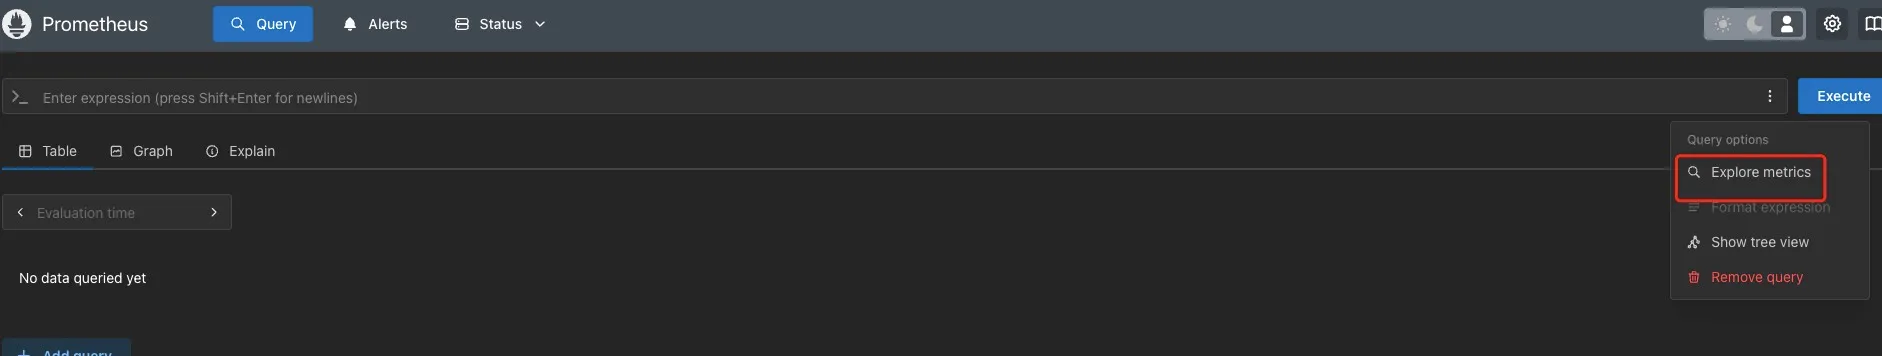
Prometheus 上有个 Query Options,里面有个 Explore metrics,可以看到每个指标的含义。